
Churn Rate Formula: How to Calculate Customer & Revenue Churn
Learn the exact churn rate formulas for customer and revenue churn, with worked examples, common mistakes, and SaaS benchmarks to measure what matters.
Introduction
Every SaaS team monitors churn, but a surprising number get the math wrong. They mix up customer counts with revenue figures, apply inconsistent time windows, or report a single churn number without specifying whether it is gross or net. The result is a metric that looks precise but misleads every downstream decision, from forecasting to retention budgeting. To calculate churn rate correctly, you need to know which formula applies to your business model, how to handle edge cases like mid-period sign-ups, and where the common traps hide. The difference between a 3% monthly churn rate and a 3% annual churn rate is the difference between a healthy business and one that replaces its entire customer base in under three years.

Understanding the Core Churn Rate Formulas
Before diving into revenue-weighted variants, it is worth locking down the customer churn formula that underpins everything else. Getting this baseline right determines whether more advanced calculations produce meaningful outputs or amplify errors.
Monthly Customer Churn Rate Calculation
The standard churn rate formula for a given month is straightforward: divide the number of customers lost during the period by the number of customers at the start of that period, then multiply by 100 to express it as a percentage. In notation: Churn Rate (%) = (Customers Lost ÷ Customers at Start of Period) × 100. Here is a worked example with clean numbers.
Starting count: You begin June with 2,000 active paying customers.
Churned customers: 80 accounts canceled or failed to renew during June.
Formula applied: (80 ÷ 2,000) × 100 = 4.0% monthly customer churn rate.
Annualized estimate: Using 1 minus (1 minus 0.04) raised to the 12th power, the compounded annual rate is roughly 39.2%, not 48%.
Common mistake: Multiplying the monthly rate by 12 overstates annual churn because it ignores the shrinking base each month.
Why the Denominator Matters More Than You Think
The most frequent source of error in churn calculation is the denominator. Some teams use the customer count at the end of the period, which artificially inflates the rate because the base is already reduced by the very losses being measured. Others use an average of start and end counts, which can mask sudden mid-month attrition spikes. The cleanest approach for most B2B SaaS teams is to use cohort analysis logic: anchor the denominator to the customer count at the start of the measurement window and exclude any new customers acquired during that window from both numerator and denominator. This prevents new sign-ups from diluting your churn signal and keeps the metric honest.

Revenue Churn vs Customer Churn: Separate Formulas, Separate Insights
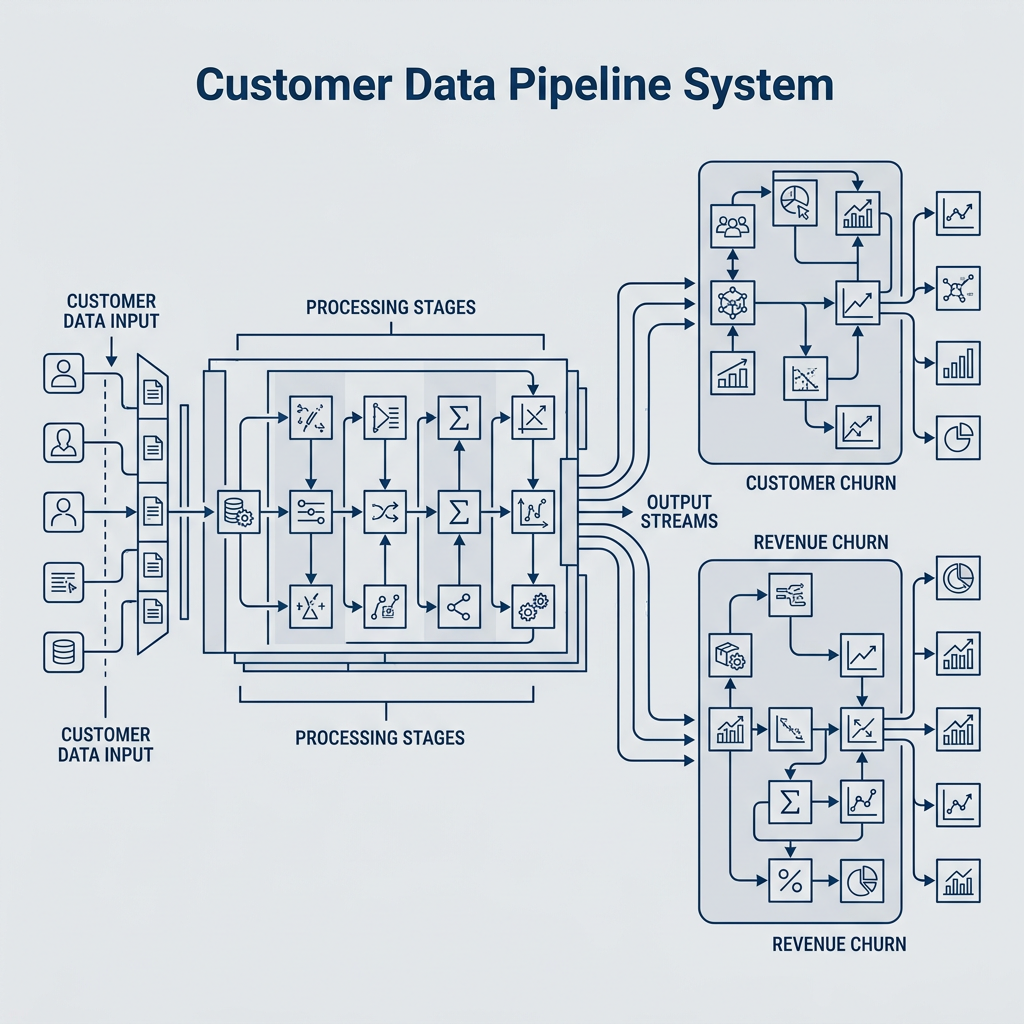
Customer churn tells you how many accounts you are losing. Revenue churn tells you how much money those losses represent. A SaaS company with tiered pricing can lose 5% of its customers while losing only 1% of its revenue (if the churned accounts were on lower-tier plans) or vice versa. Treating these as interchangeable is one of the analytics mistakes that quietly distorts growth planning.
Gross Revenue Churn and Net Revenue Churn
Gross revenue churn measures only the MRR lost to cancellations and downgrades during a period. The formula is: Gross Revenue Churn (%) = (MRR Lost to Churn + MRR Lost to Downgrades) ÷ MRR at Start of Period × 100. This gives you the raw damage number before any expansion revenue is factored in.
Net revenue churn subtracts expansion MRR (upsells, cross-sells, seat additions) from that loss figure before dividing. Net Revenue Churn (%) = (MRR Lost to Churn + MRR Lost to Downgrades, minus Expansion MRR) ÷ MRR at Start of Period × 100. When expansion revenue exceeds losses, net churn goes negative, which is the hallmark of efficient SaaS growth. Understanding this distinction between net churn and gross churn is critical for any team running retention-focused sprints.
Worked Revenue Churn Example
Suppose a company starts the month at $500,000 MRR. During the month, $15,000 is lost to cancellations and $5,000 to downgrades. Meanwhile, existing customers expand by $25,000 through upsells. Gross revenue churn is ($15,000 + $5,000) ÷ $500,000 × 100 = 4.0%. Net revenue churn is ($15,000 + $5,000, minus $25,000) ÷ $500,000 × 100 = negative 1.0%. That negative sign means the existing customer base is actually growing in revenue terms, even though some accounts have left. This is exactly why tracking customer lifetime value alongside churn paints a more complete picture than either metric alone.
Common Churn Calculation Mistakes and How to Avoid Them
Even teams that know the formulas frequently introduce errors through implementation details. These mistakes do not show up as broken dashboards. They show up as confident, wrong numbers that quietly inform bad decisions for months.
Double-Counting Reactivations and Ignoring Time Windows
One persistent error involves reactivated accounts. If a customer cancels in March and resubscribes in April, some systems count that account as churned in March and new in April, which inflates both the churn rate and the new acquisition count. The cleaner approach is to flag reactivations as a separate category in your product usage analytics pipeline so they do not corrupt either metric. Most billing platforms (Stripe, Chargebee, Recurly) emit subscription events that can be parsed to distinguish genuine new customers from returning ones.
Time window inconsistency is another trap. Comparing a 28-day February churn rate to a 31-day March rate introduces noise that has nothing to do with actual customer behavior. Standardizing to a 30-day normalized window or using weekly churn rates aggregated to monthly totals eliminates this calendar artifact.
Confusing Churn Rate With Retention Rate
Churn rate and retention rate are mathematical complements, not synonyms, but the relationship is not always as simple as subtracting one from 100%. A 5% monthly churn rate does not automatically mean 95% monthly retention if your denominator definitions differ between the two calculations. The safest practice is to derive retention directly from the same cohort-anchored denominator used for churn: Retention Rate (%) = 100 minus Churn Rate (%), calculated on the same base of customers at the start of the period. Teams that track retention metrics as a first-class KPI alongside churn avoid the blind spots that emerge when only one side of the equation is measured.
Choosing the Right Formula for Your Business Model
Not every SaaS company should track the same churn variant with the same weight. The right formula depends on pricing structure, contract type, and where the business sits in its growth curve.
When to Prioritize Customer Churn vs Revenue Churn
For early-stage products with flat, single-tier pricing, the customer churn formula is the most actionable metric because every lost account represents the same revenue impact. There is no weighting problem to solve. For companies with tiered or usage-based pricing, revenue churn becomes a more meaningful signal because losing a $50/month account and a $5,000/month account are materially different events. B2B SaaS companies in the United States with annual contracts should also track logo churn (customer count) at the renewal cohort level, since the annual churn rate measured quarterly can produce misleading smoothing effects. Platforms like TrackRaptor publish benchmarks and frameworks that help teams match the right metric to their contract structure and growth stage.
North American B2B SaaS Benchmarks for Context
Raw churn numbers mean nothing without benchmarks. For B2B SaaS companies in the United States, a widely cited median is 5% to 7% annual gross revenue churn for companies with primarily annual contracts, though this varies significantly by ACV tier. Companies selling below $1,000 ACV tend to see higher churn rates, often 3% to 5% monthly, while enterprise products above $50,000 ACV frequently operate below 5% annually. According to industry analyses of B2B churn, the average SaaS churn rate for North American mid-market companies clusters around 8% to 12% annually when measured on a logo basis. The gap between logo churn and revenue churn is itself a diagnostic signal: if your revenue churn is significantly lower than your customer churn, your product is retaining higher-value accounts, which is a growth signal worth protecting.
Conclusion
Calculating churn correctly requires more than plugging numbers into a single formula. It means choosing the right variant (customer vs. revenue, gross vs. net), anchoring your denominator to a clean starting count, and normalizing for time windows so monthly comparisons hold up. Use customer churn for flat-pricing models and early-stage diagnostics, and shift to revenue churn as pricing complexity grows. Compare your numbers against SaaS benchmarks relevant to your ACV tier and contract type, and treat behavioral signals as leading indicators that feed the churn figures you see after the fact.
Explore TrackRaptor's full library of churn and retention frameworks to build a measurement stack that goes beyond surface-level metrics.
Frequently Asked Questions (FAQs)
How to calculate the monthly churn rate?
Divide the number of customers lost during the month by the total number of customers at the start of that month, then multiply by 100 to get the percentage.
What is a good churn rate for SaaS?
For B2B SaaS with annual contracts, a gross revenue churn rate below 7% annually is generally considered healthy, though the target varies by ACV tier and business maturity.
How does revenue churn compare to customer churn?
Revenue churn measures the dollar value of lost MRR from cancellations and downgrades, while customer churn counts the number of accounts lost regardless of their individual revenue contribution.
Why is churn rate important?
Churn rate directly determines how much new revenue a company needs to acquire just to maintain its current run rate, making it the single most influential variable in long-term SaaS growth modeling.
What causes a high churn rate?
Common drivers include poor onboarding that prevents users from reaching their first value milestone, misalignment between pricing and perceived value, and a lack of proactive engagement with at-risk accounts showing declining product usage.