
How to Cut Freight Costs Using Shipping Data Analytics
Learn how shipping data analytics helps cut freight costs. Discover key metrics, carrier benchmarking tactics, and tools that drive real logistics savings.
Introduction
Shipping costs remain one of the largest controllable line items in any logistics operation, yet most companies still manage freight spend with static spreadsheets and quarterly carrier reviews that miss real-time savings opportunities. Shipping data analytics transforms that dynamic by giving operations and data teams the ability to monitor cost drivers continuously, benchmark carrier rates against market conditions, and identify waste that manual processes simply cannot detect. For businesses across the United States and Canada facing volatile carrier pricing and growing supply chain complexity, the gap between data-driven logistics optimization and traditional freight management is now measured in percentage points of margin. The companies pulling ahead are the ones treating shipping not as a fixed cost but as an optimizable variable where every route, mode, and surcharge is a data point waiting to be acted on.
Key Takeaway: To meaningfully reduce shipping costs, teams need to move beyond periodic rate negotiations and build continuous analytics workflows that track freight spend at the lane, carrier, and surcharge level, then use those insights to renegotiate contracts, consolidate shipments, and automate mode selection.

Building the Foundation for Freight Cost Management
Effective shipping cost optimization starts long before you install a dashboard or run a report. It begins with understanding what data you actually have, where it lives, and how clean it is. Most logistics teams discover that their freight data is fragmented across carrier portals, ERP systems, TMS platforms, and email inboxes, making any kind of meaningful analysis impossible without a centralized data layer.
Centralizing and Cleaning Freight Data
The first step in any freight spend management initiative is consolidation. Every invoice, tracking event, rate confirmation, and accessorial charge needs to flow into a single repository where it can be normalized and queried. Without this, you are comparing apples to invoices formatted in three different currencies with inconsistent surcharge line items. Teams that invest in data quality dimensions early avoid months of reconciliation headaches later.
Invoice normalization: Standardize carrier invoice formats so base rates, fuel surcharges, and accessorial fees are broken into consistent columns across all providers.
Shipment-level granularity: Map every cost element back to the individual shipment, including origin, destination, weight, mode, and delivery date.
Automated ingestion: Build or configure data pipeline architecture that pulls carrier data via API or EDI rather than relying on manual CSV uploads.
Duplicate and error detection: Flag invoices that contain duplicate charges, incorrect weight classifications, or surcharges that do not match contractual terms.
Defining the Metrics That Actually Matter
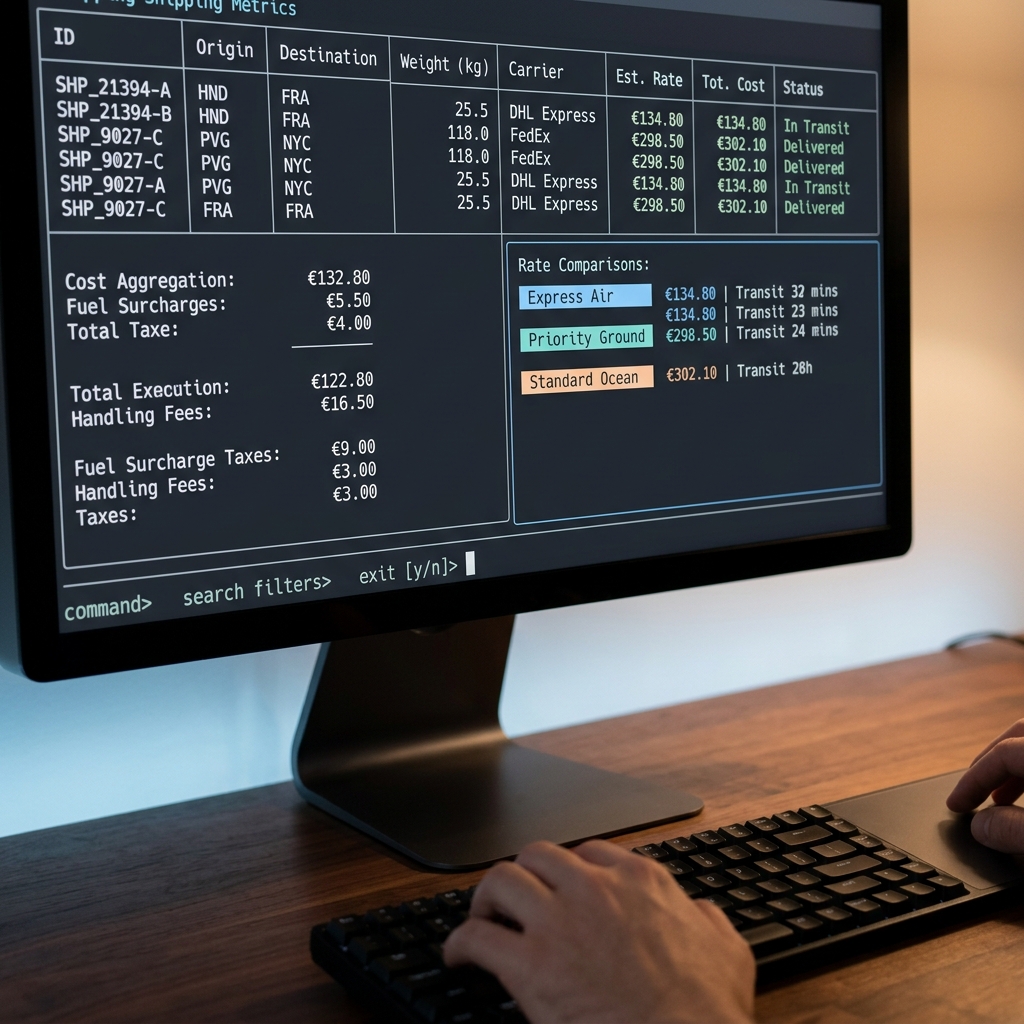
Once your data is centralized, the next challenge is knowing what to measure. Many teams default to tracking total freight spend month over month, which tells you almost nothing about where waste is occurring. Shipping performance metrics need to be granular enough to surface actionable patterns. Cost per pound per lane, on-time delivery rate by carrier, accessorial charges as a percentage of total spend, and average transit time variance are all far more useful than top-line totals. The research on data science methodologies in logistics confirms that organizations using lane-level and carrier-level KPIs consistently outperform those relying on aggregated spend reports. Teams that have experience building metrics frameworks for product management will recognize the same principle here: vanity metrics hide problems while operational metrics expose them.
Turning Shipping Analytics Into Freight Savings
Clean data and the right metrics are necessary but insufficient. The payoff comes when teams use analytics to make different decisions: switching carriers on underperforming lanes, consolidating shipments, renegotiating contracts with hard evidence, and automating mode selection based on cost and service tradeoffs. This is where shipping data analytics stops being a reporting exercise and becomes a freight cost reduction engine.
Carrier Rate Benchmarking and Multi-Carrier Optimization
Carrier rate optimization requires more than comparing the base rates in your current contracts. It means benchmarking your actual per-shipment costs, including all surcharges and accessorials, against market rates and alternative carriers on a lane-by-lane basis. Multi-carrier shipping optimization is the practice of dynamically routing shipments to the best carrier for each specific lane, service level, and shipment profile rather than defaulting to a single preferred provider.
The table below compares traditional freight management methods against a data-driven approach across the dimensions that most directly affect cost and service quality.
Dimension | Traditional Methods | Data-Driven Approach |
|---|---|---|
Rate Review Frequency | Quarterly or annual RFPs | Continuous, real-time benchmarking |
Carrier Selection | Manual, based on relationships | Automated per-lane, per-shipment routing |
Surcharge Visibility | Buried in invoice line items | Normalized, tracked as a percentage of total spend |
Waste Detection | Discovered months later during audits | Flagged in real time through anomaly detection |
Negotiation Leverage | Based on volume commitments alone | Backed by lane-level cost and performance data |
The core takeaway: traditional methods are reactive. By the time a quarterly review surfaces a cost problem, the overspend has already compounded across hundreds or thousands of shipments. A data-driven approach catches it on shipment one. For benchmarking against market-level conditions in the United States, the Bureau of Transportation Statistics freight indicators provide publicly available baseline data that teams can use to validate whether their contracted rates are competitive. Organizations tracking shipping cost benchmarking against these public indexes consistently identify 5% to 15% savings opportunities hiding in their existing carrier agreements.
Using Predictive Analytics to Reduce Shipping Expenses
Predictive analytics takes shipping expense reduction beyond historical reporting and into forward-looking decision-making. By analyzing seasonal demand patterns, historical transit time variability, and container freight rate fluctuations, teams can forecast cost spikes before they hit and pre-negotiate capacity or shift modes proactively. For example, if your analytics surface a pattern where LTL rates on a specific corridor spike 20% every November, you can lock in contract rates or consolidate shipments into FTL moves ahead of the surge.
The same predictive capabilities help identify shipping waste with analytics. Anomaly detection models can flag shipments where actual costs deviate significantly from expected costs, catching billing errors, unnecessary accessorial charges, and suboptimal routing in near real time. TrackRaptor's analytics capabilities demonstrate how continuous tracking infrastructure applies to exactly these kinds of operational data flows. Teams already familiar with analytics metrics that drive growth in SaaS will recognize the parallel: the same event-level instrumentation that tracks user behavior can track shipment behavior, and the cost insights are just as actionable.

Conclusion
Reducing freight costs is not a one-time negotiation exercise. It is a continuous analytics discipline that requires clean, centralized data, the right shipping performance metrics, and workflows that turn insights into carrier decisions on a per-shipment basis. Teams that invest in building this infrastructure, whether through dedicated shipping analytics tools or by extending their existing semantic layer to cover logistics data, consistently find savings that static processes miss entirely. The freight market will keep moving, and the organizations that track it in real time are the ones that control their costs instead of reacting to them. Start with data centralization, define lane-level metrics, benchmark aggressively, and let TrackRaptor and the principles of event taxonomy governance guide how you instrument the process.
Frequently Asked Questions (FAQs)
How can data reduce shipping costs?
Data reduces shipping costs by exposing lane-level inefficiencies, billing errors, and suboptimal carrier selections that manual processes and spreadsheets consistently miss.
What metrics matter in logistics optimization?
Cost per pound per lane, accessorial charges as a percentage of total spend, on-time delivery rate by carrier, and transit time variance are the most actionable metrics for freight cost management.
How to audit shipping expenses?
Audit shipping expenses by normalizing all carrier invoices into a single dataset, then comparing actual charges against contracted rates at the shipment level to flag overcharges and unauthorized surcharges.
Can predictive analytics lower logistics costs?
Predictive analytics can lower logistics costs by forecasting seasonal rate spikes, demand surges, and transit disruptions so teams can pre-negotiate capacity or shift transportation modes before costs increase.
How to benchmark shipping performance?
Benchmark shipping performance by comparing your per-lane, per-carrier costs and service levels against public freight indexes and aggregated industry data on a continuous, not quarterly, basis.
What is the best shipping cost management platform vs spreadsheets?
Dedicated shipping analytics platforms outperform spreadsheets by automating data ingestion, normalizing multi-carrier invoices, and enabling real-time anomaly detection that spreadsheets cannot replicate at scale.
How does real-time shipping tracking compare to manual tracking?
Real-time tracking surfaces cost anomalies and delivery exceptions within hours, while manual tracking typically delays problem detection by days or weeks, compounding overspend across shipments.